How to Check the Funnel Reports
Understanding your funnel’s performance is crucial for optimizing user engagement and conversions. Kea Builder provides a robust reporting section that allows you to analyze key performance indicators and download reports for further insights.
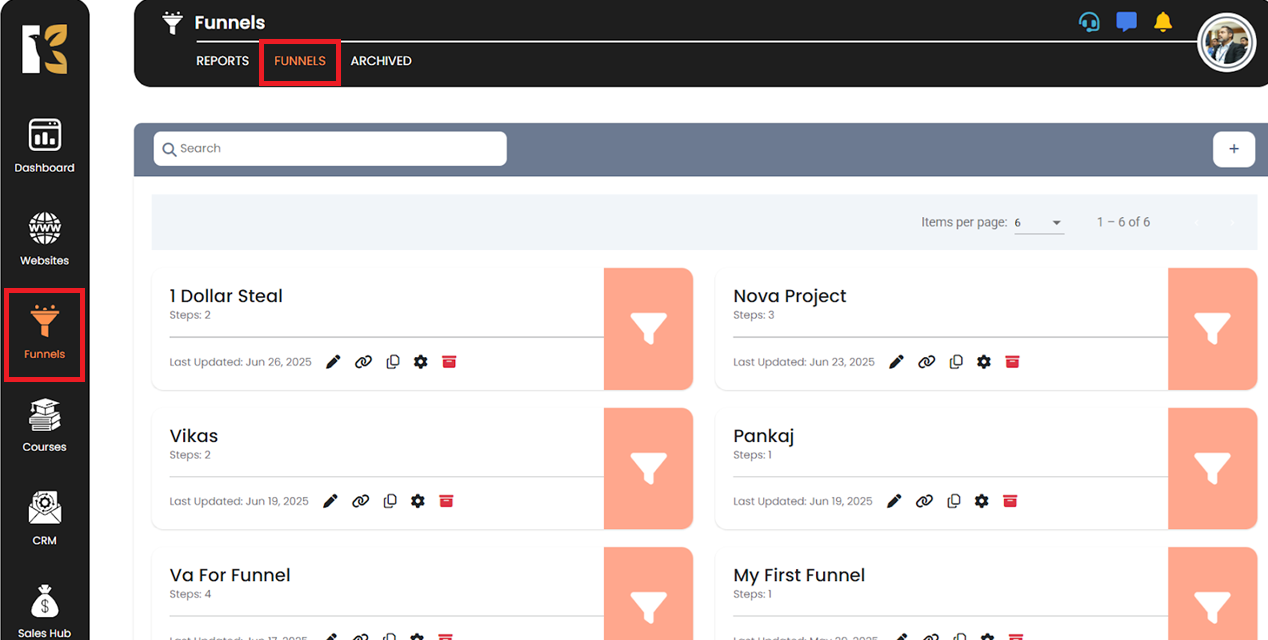
🔹 Step 1: Navigate to Funnels
From the left-side menu on your Kea Builder dashboard, click on “Funnels.”
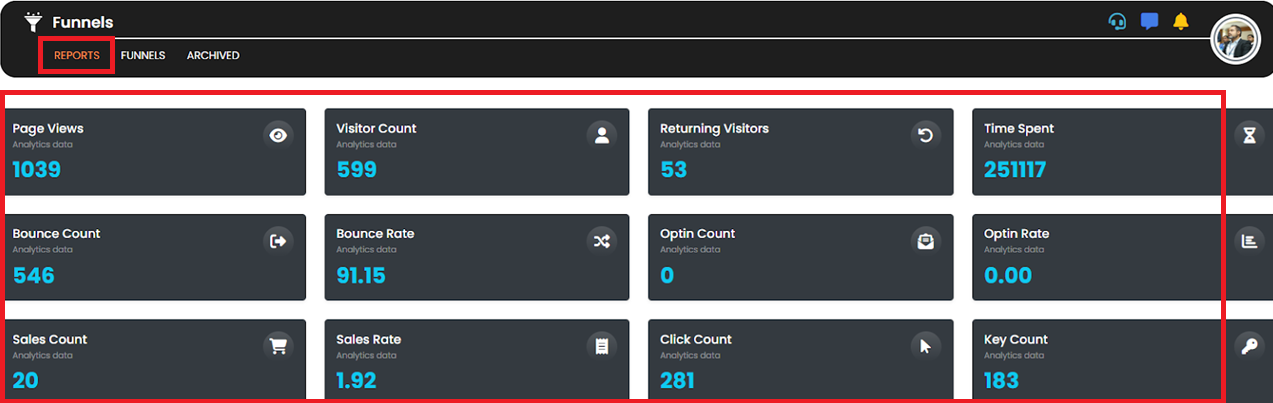
🔹 Step 2: Open the “Reports” Section
At the top-left menu bar, click on the “Reports” tab.
This will open the Funnel Reports Dashboard, where you can view a comprehensive summary of metrics including:
- Page Views
- Visitor Count
- Returning Visitors
- Time Spent
- Bounce Count & Bounce Rate
- Opt-in Count & Opt-in Rate
- Sales Count & Sales Rate
- Click Count & Click Rate
🔹 Step 3: Download the Report
Scroll to the bottom of the page. You’ll find download options available in three formats:
- SVG (for visual charts)
- PNG (image format)
- CSV (spreadsheet format)
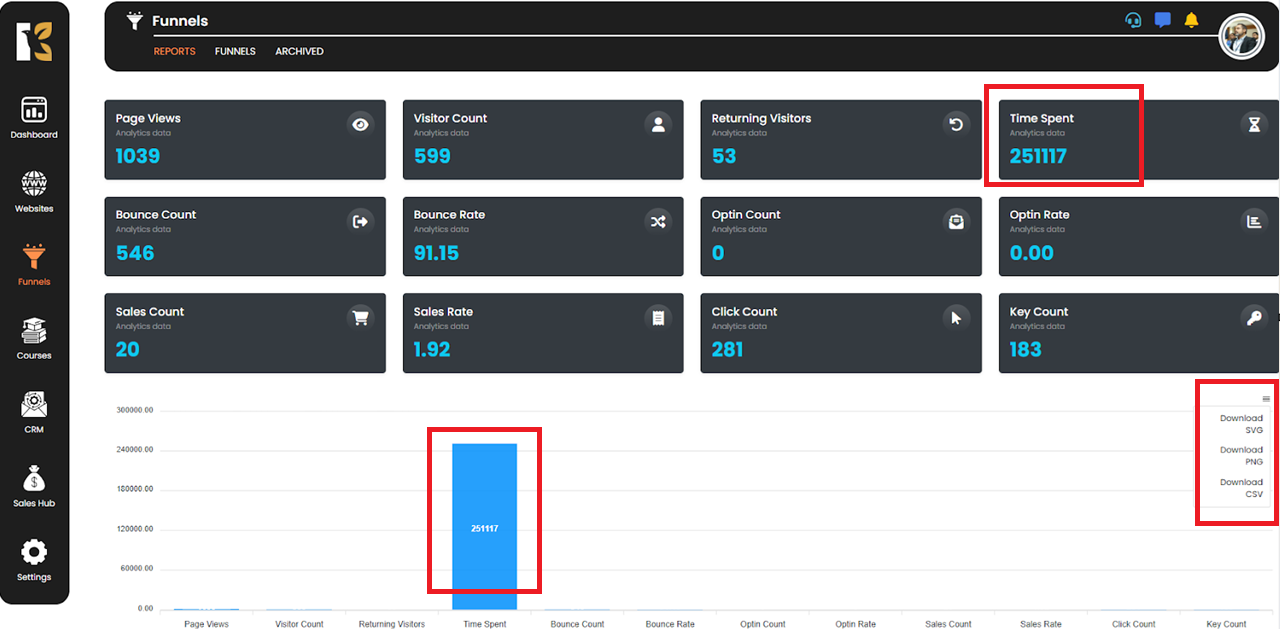
Just click the respective icon to export the report.
✅ Tip:
Use CSV exports for deeper analysis in Excel or Google Sheets.