How to Check Funnel Stats
Monitoring your funnel’s performance is key to making strategic decisions and increasing conversions. Kea Builder provides in-depth analytics for each funnel step to help you measure success and identify opportunities for improvement.
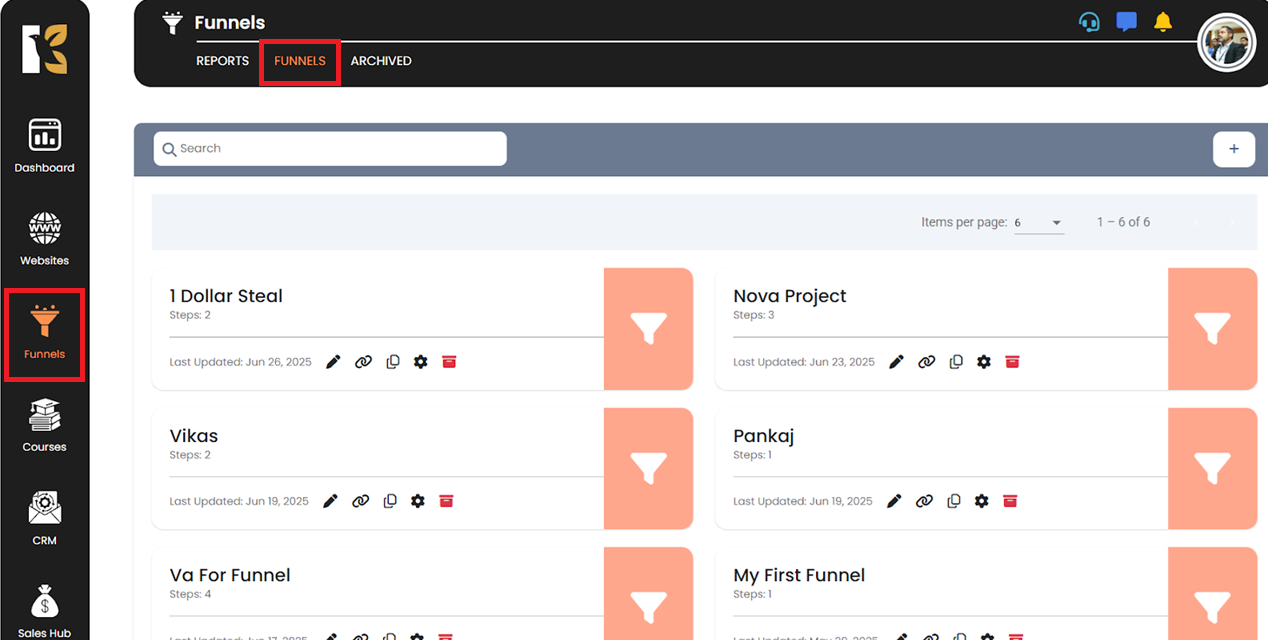
🔹 Step 1: Navigate to Funnels
From the left-hand menu in your Kea Builder Dashboard, click on “Funnels” to open the Funnel Management Dashboard.
🔹 Step 2: Select the Funnel to Analyze
Find the funnel you want to review and click on the “Edit” icon next to it.

🔹 Step 3: Access Funnel Analytics
Click the Bar Graph icon in the top-right corner of the funnel editor to open the performance dashboard.

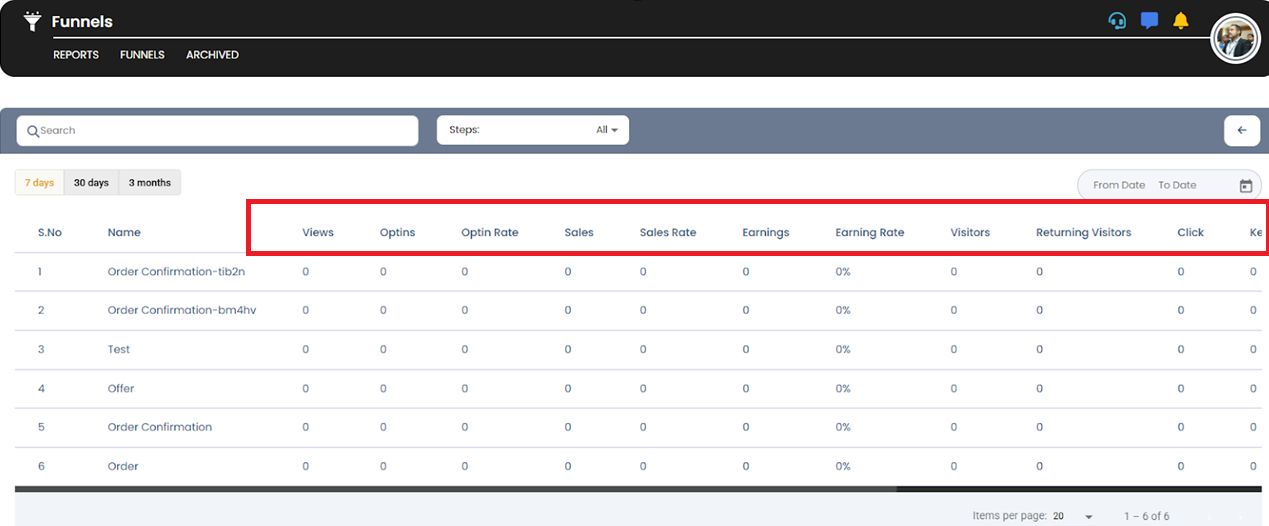
📈 What You’ll See in the Funnel Stats Panel
You’ll gain insights into detailed metrics such as:
- Funnel Step Views
- Opt-ins & Opt-in Rate
- Sales & Sales Rate
- Earnings & Earnings Rate
- Visitors & Returning Visitors
- Clicks & Time Spent on Page
- Bounce Count & Bounce Rate
- Other Key Engagement Metrics
🔹 Step 4: Access Funnel Analytics - Date Wise
Click on the Calendar icon at the extreme right. You will find the option to select Start Date & End Date for the period you want to track funnel performance.
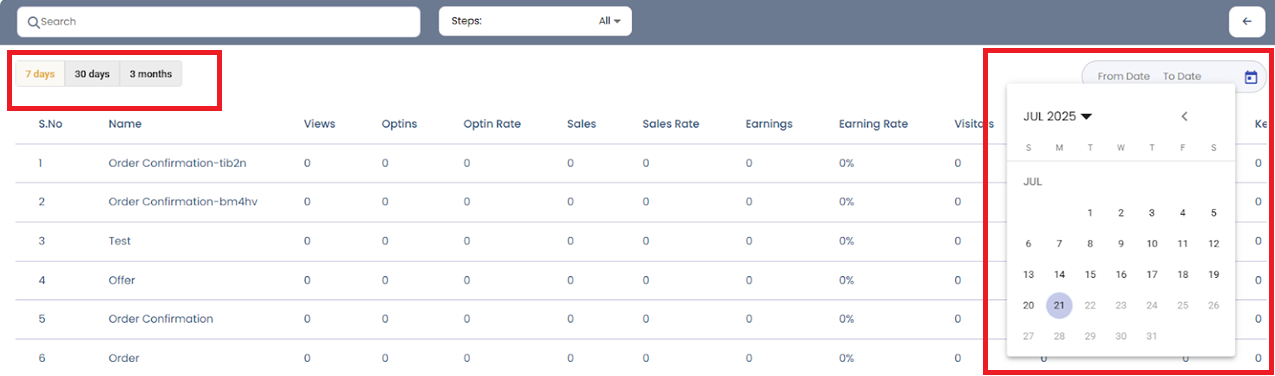
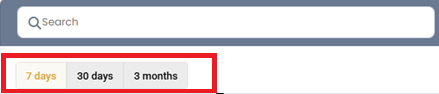
Alternatively, use the quick filters like “7-days,” “30-days,” or “3-months” for instant report generation—available by clicking the quick filter buttons below the search bar.
💡 Use Case:
Leverage this data to refine your content, adjust CTAs, improve user experience, and optimize your conversion path based on real-time behavior.
✅ Pro Tip:
Regularly review these stats to keep your funnels high-performing and conversion-optimized!