How to View Your Sales Report in Sales Hub
Monitoring your sales performance is crucial for understanding your business growth, tracking revenues, and making informed decisions. The Sales Hub provides a comprehensive Reports Dashboard that gives you a complete overview of your total sales, subscriptions, product performance, and payment activities — all in one place.
Here’s a detailed, step-by-step guide to help you access and understand your Sales Reports.
Step 1: Log In and Access the Main Dashboard
- Start by logging in to your account.
- After successful login, you’ll be redirected to the Main Dashboard, which serves as your central control panel.
- From here, you can easily navigate to various modules, including the Sales Hub.

Step 2: Open the Sales Hub
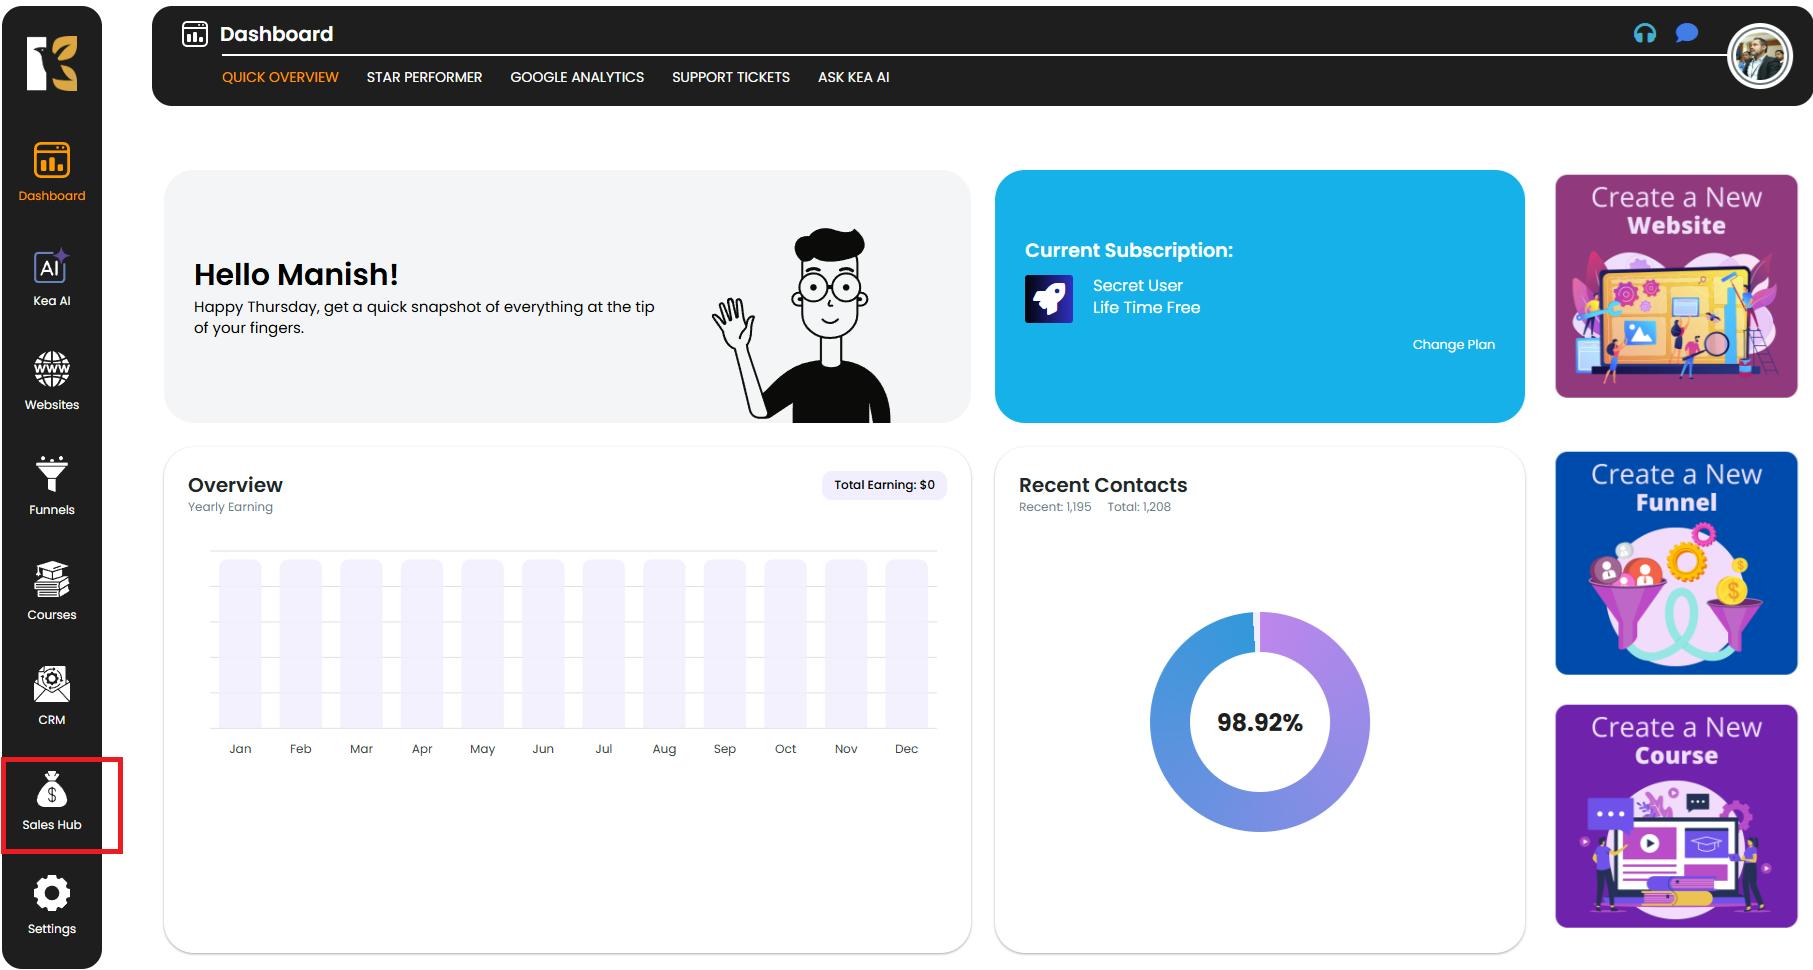
- On the left-hand vertical menu bar, scroll down until you find the Sales Hub option.
- Click on Sales Hub to open the Sales Management Section.
- By default, you’ll be redirected to the Reports section inside the Sales Hub.
Step 3: Navigate to the Reports Dashboard
- Once inside the Sales Hub, you’ll automatically land on the Sales Reports Dashboard.
- The horizontal menu bar at the top will highlight Reports, confirming that you’re in the right section.
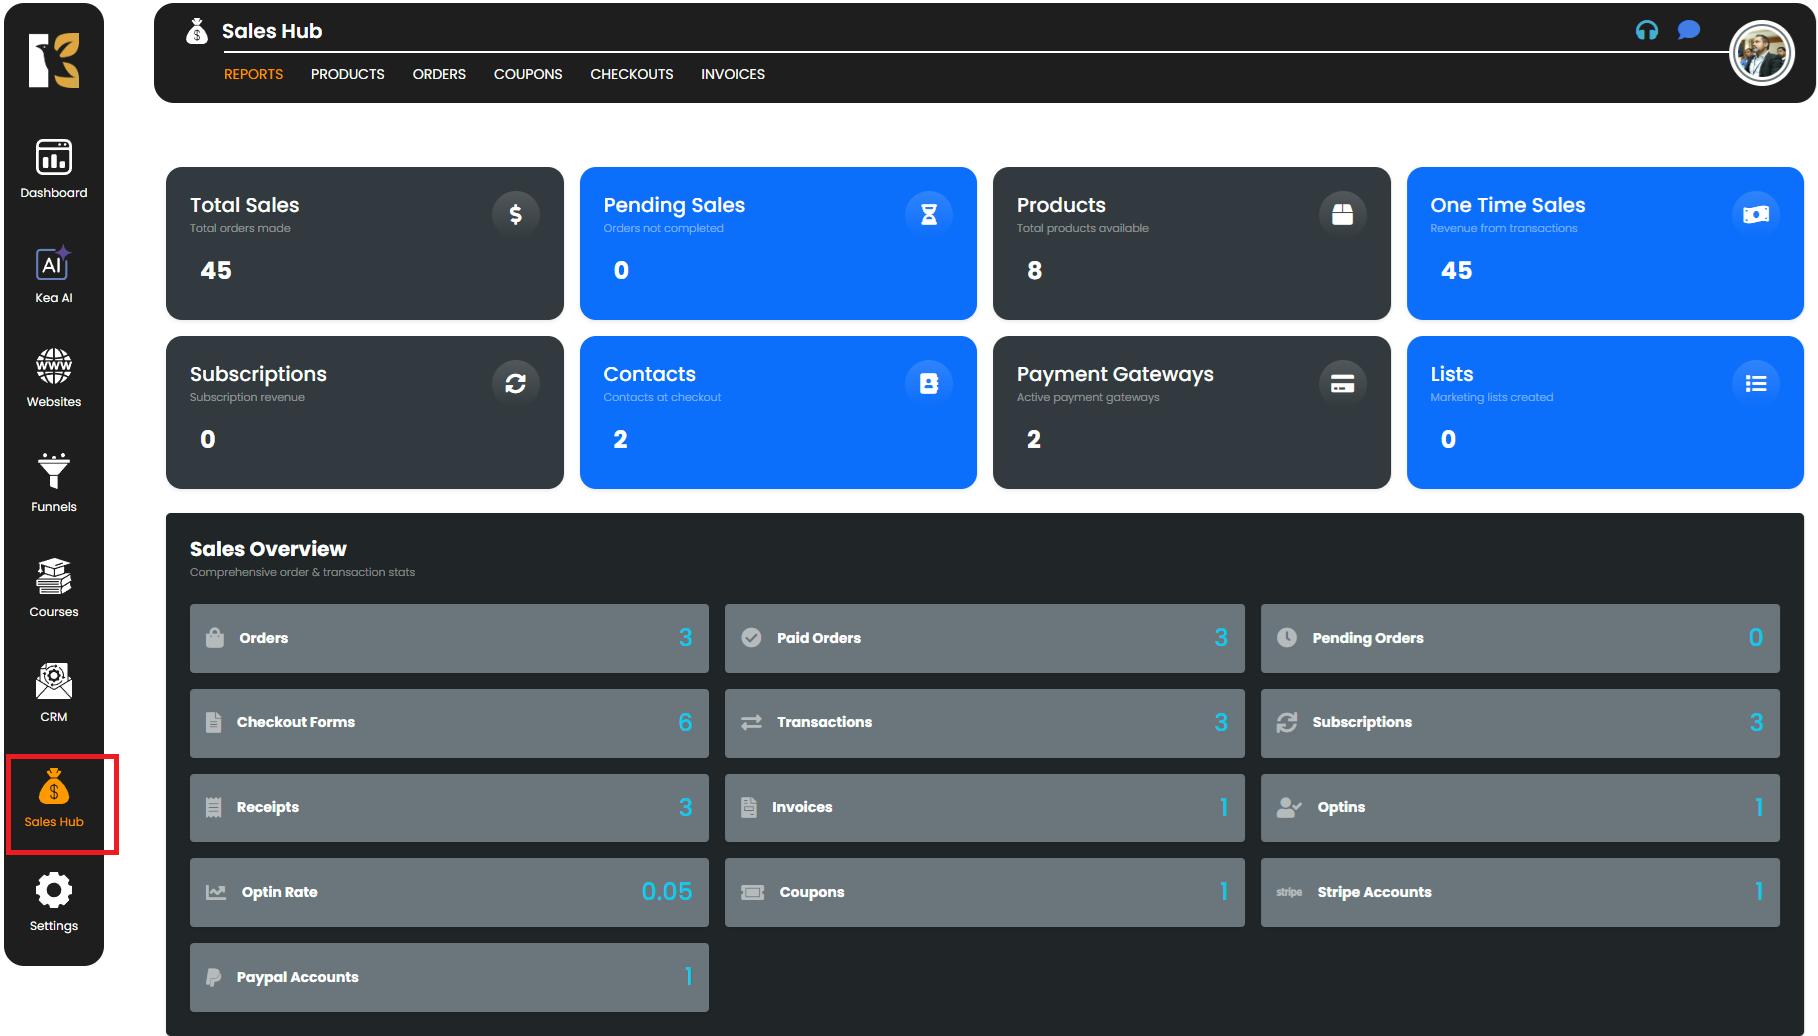
Step 4: Understand the Key Metrics Displayed
The Reports Dashboard displays several data boxes, each representing different aspects of your sales performance. These provide real-time insights at a glance:
- Total Sales → Shows the overall revenue generated.
- Pending Sales → Displays the value of orders that have been initiated but not yet processed or completed.
- Subscriptions → Summarizes recurring payments and subscription-based purchases.
- Products → Gives a breakdown of product-wise performance to help identify your best-sellers.
- Payment Gateways → Highlights payment method usage and contribution to total sales.
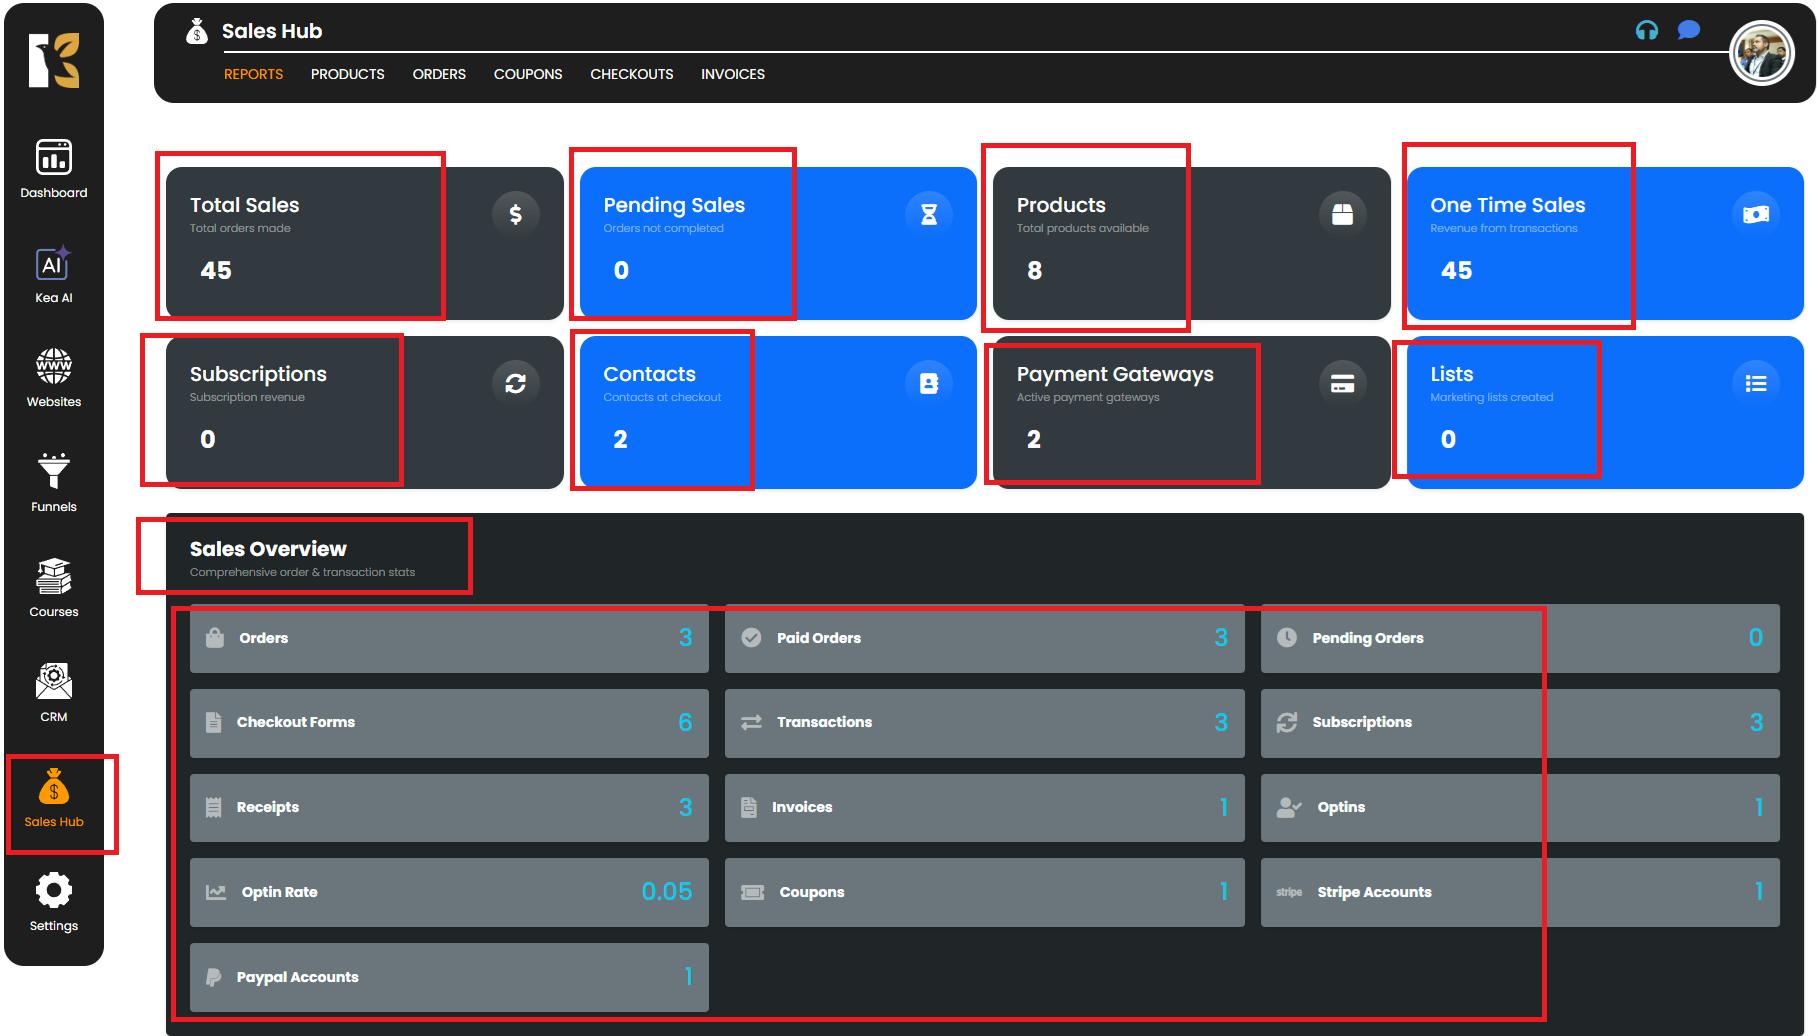
Tip: Clicking on any of these boxes often provides a drill-down view for deeper insights into that specific metric.
Step 5: Analyze Your Overall Sales Performance
- The dashboard is designed to give you a holistic snapshot of your sales activities.
- You can quickly:
- Monitor your total revenue trends.
- Compare one-time vs. recurring payments.
- Identify your top-performing products.
- Evaluate which payment gateways customers prefer.
- These insights help you optimize pricing, plan marketing strategies, and forecast growth more effectively.
Pro Tips for Maximizing Sales Insights
- Check regularly → Monitor your dashboard daily or weekly to stay on top of trends.
- Use filters → Narrow down reports by products, gateways, or subscription types.
- Compare timeframes → Analyze performance over different periods for better decision-making.
- Spot growth opportunities → Use subscription and product reports to focus on profitable areas.
Conclusion
The Sales Reports Dashboard in the Sales Hub is your centralized analytics tool for tracking and understanding your business performance. By reviewing these reports regularly, you gain actionable insights into total revenue, subscriptions, payment gateways, and product trends, enabling you to make smarter, data-driven decisions to grow your business.