How to View the Stats of Your Webpage in KeaBuilder
KeaBuilder allows you to track the performance of your webpages with detailed statistics such as views, clicks, opt-ins, conversion rates, and more. These insights help you analyze visitor behavior and optimize your website for better results.
Here’s a step-by-step walkthrough to check the stats of your webpages:
Step 1: Log In to KeaBuilder
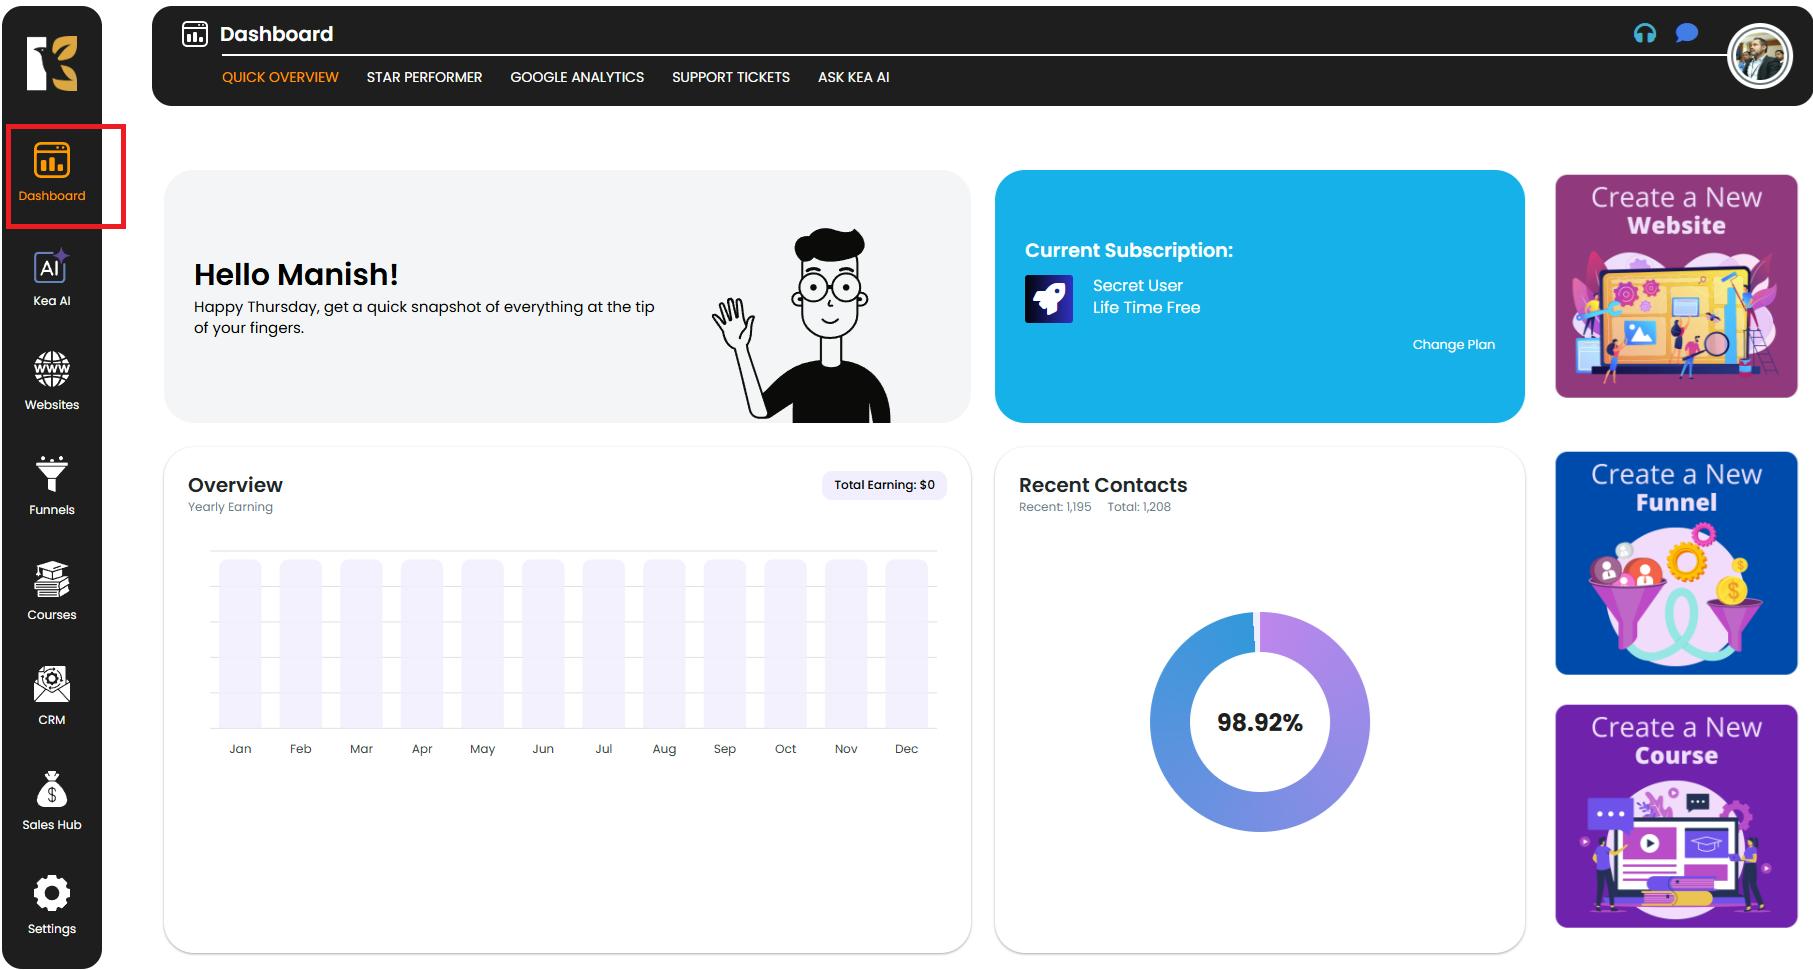
- Start by logging in to your KeaBuilder account using your username and password.
- Once logged in, you’ll land on the Main Dashboard, which provides access to all your tools and projects.
Step 2: Navigate to the Websites Section
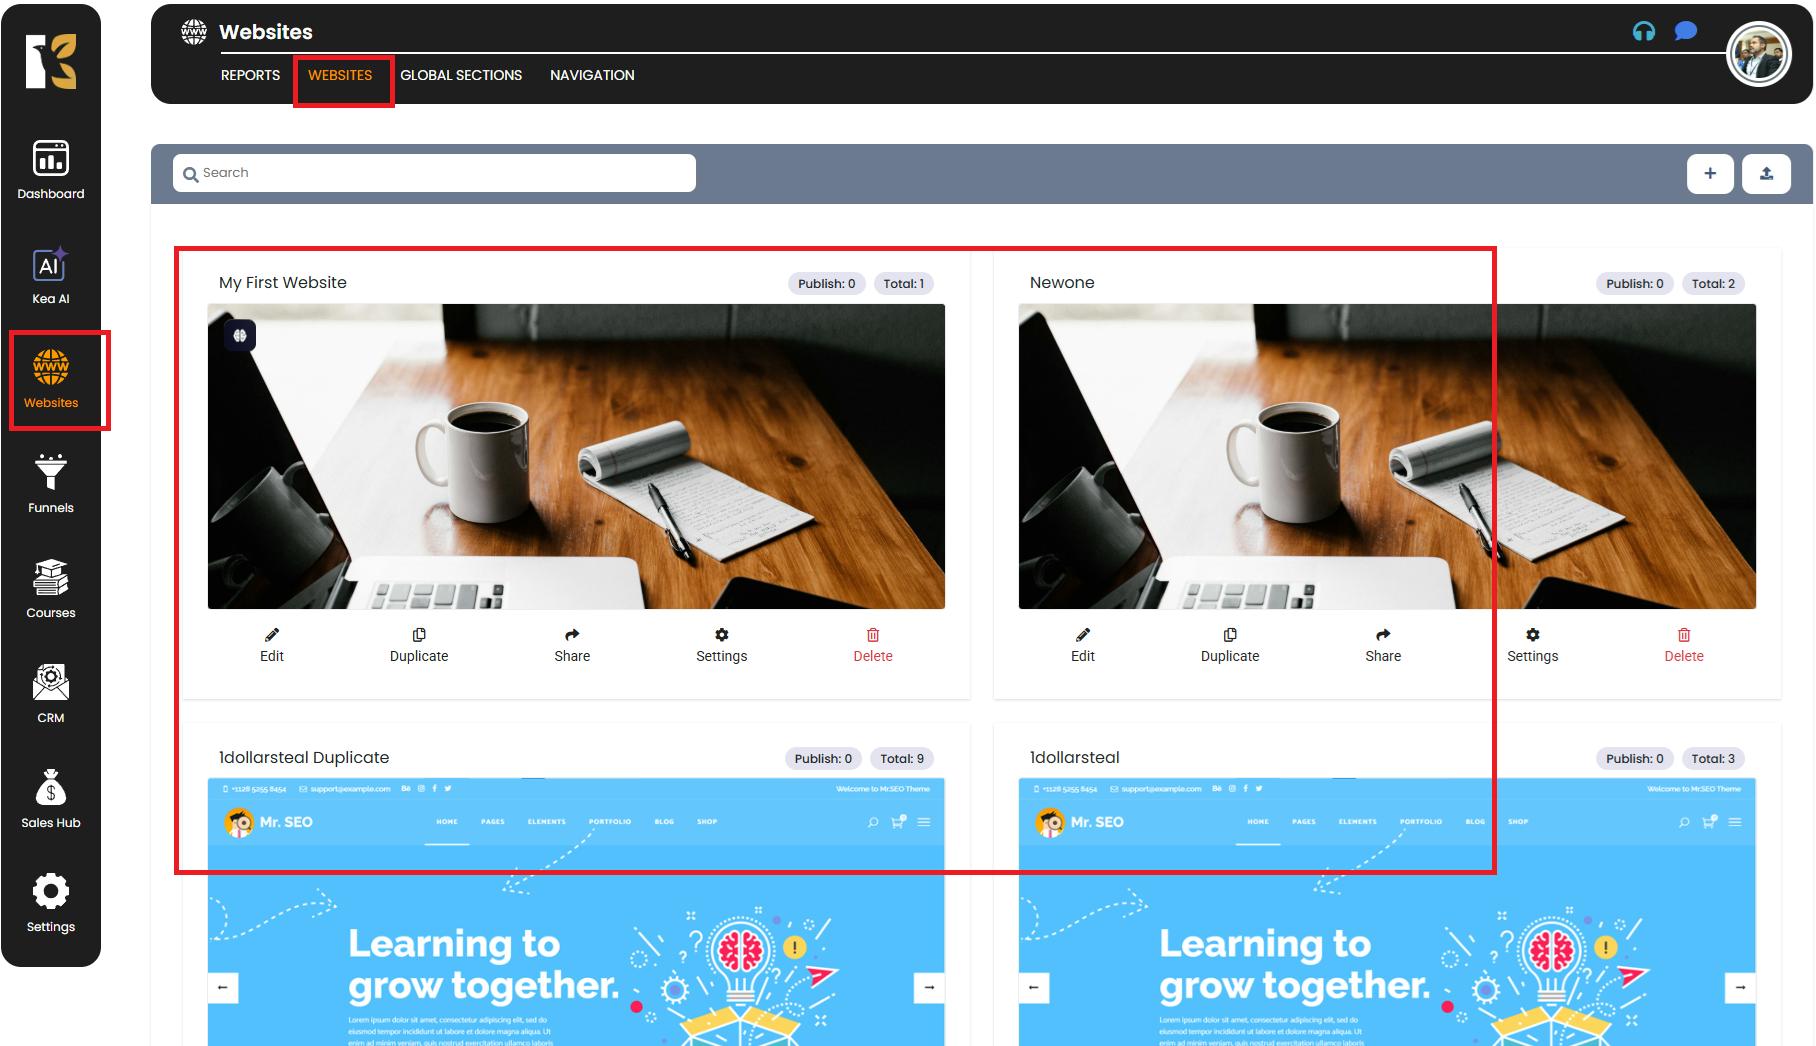
- On the left-hand vertical menu, scroll down until you see the Websites option.
- Click on it to open the Websites Management Section.
- Here, you will find a list of all the websites you’ve created in KeaBuilder.
Step 3: Select Your Website
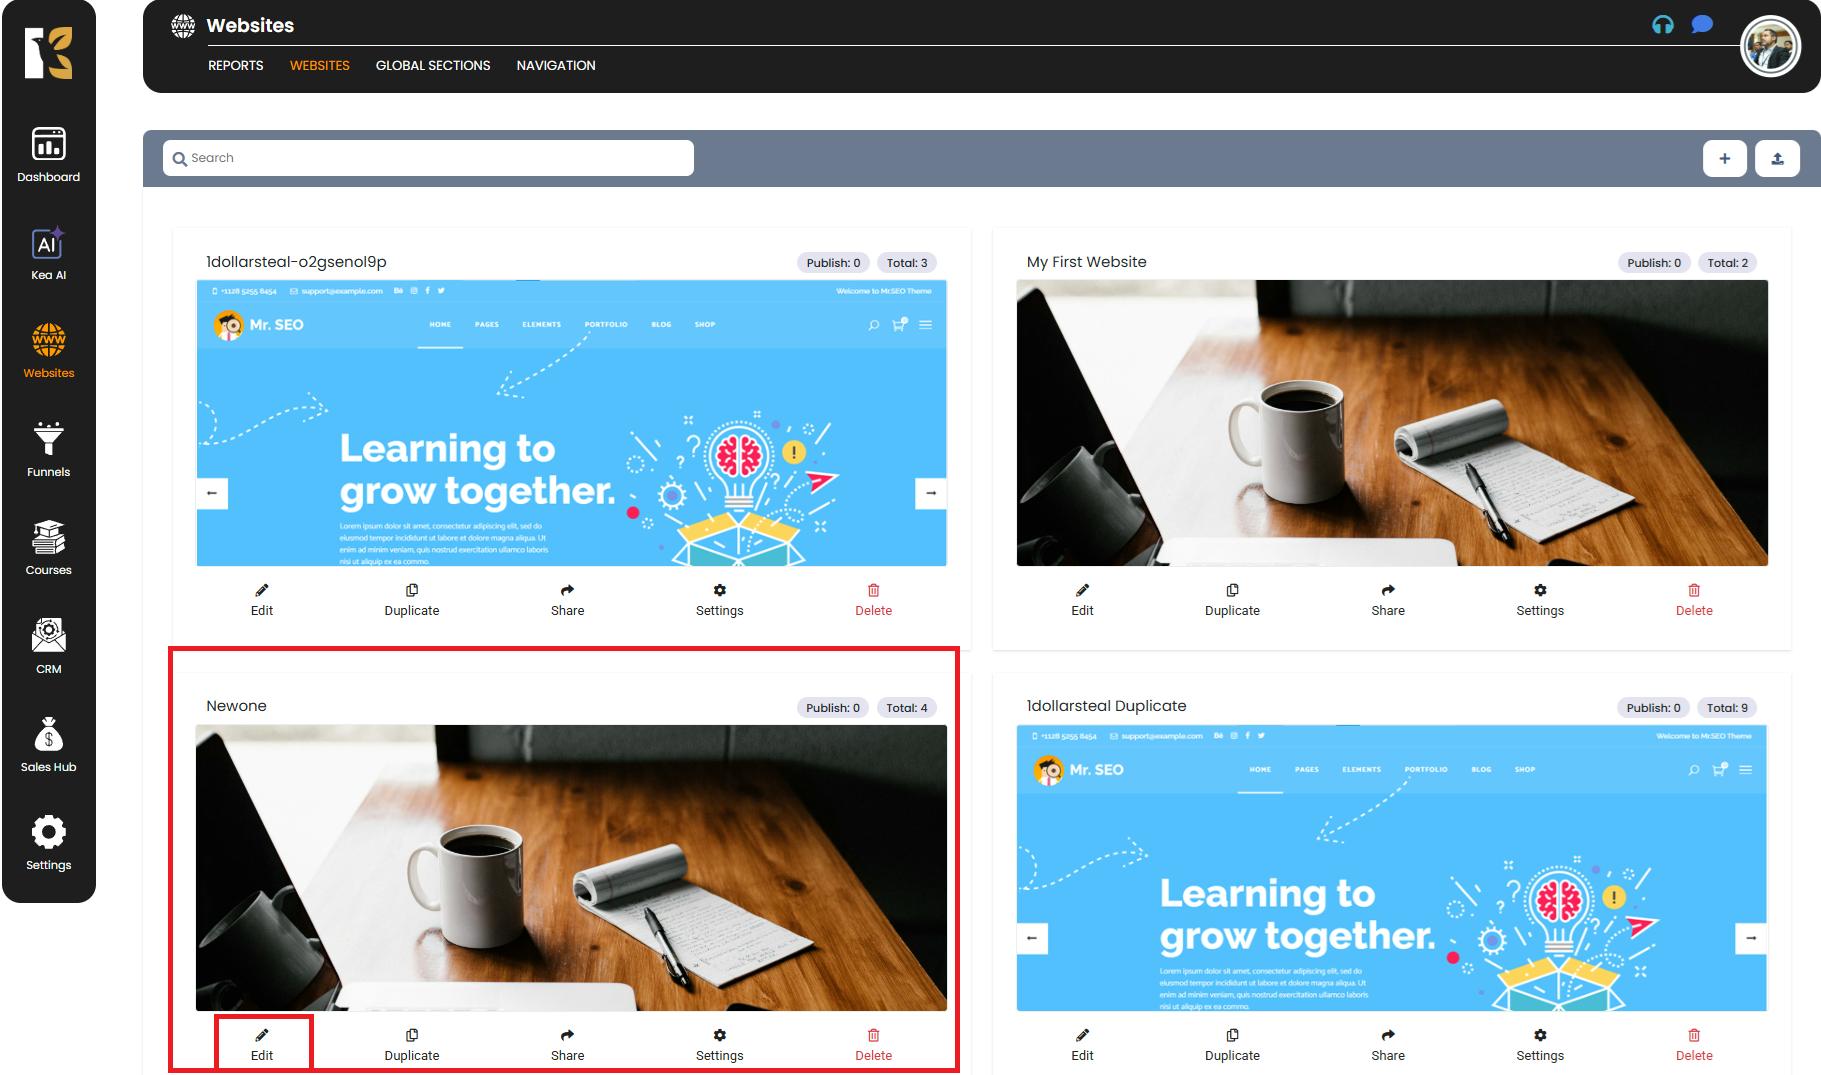
- Choose the website for which you want to analyze page statistics.
- Below the website’s name, click on the Edit (Pencil) icon to open its Website Dashboard.
Step 4: Access the Website Dashboard
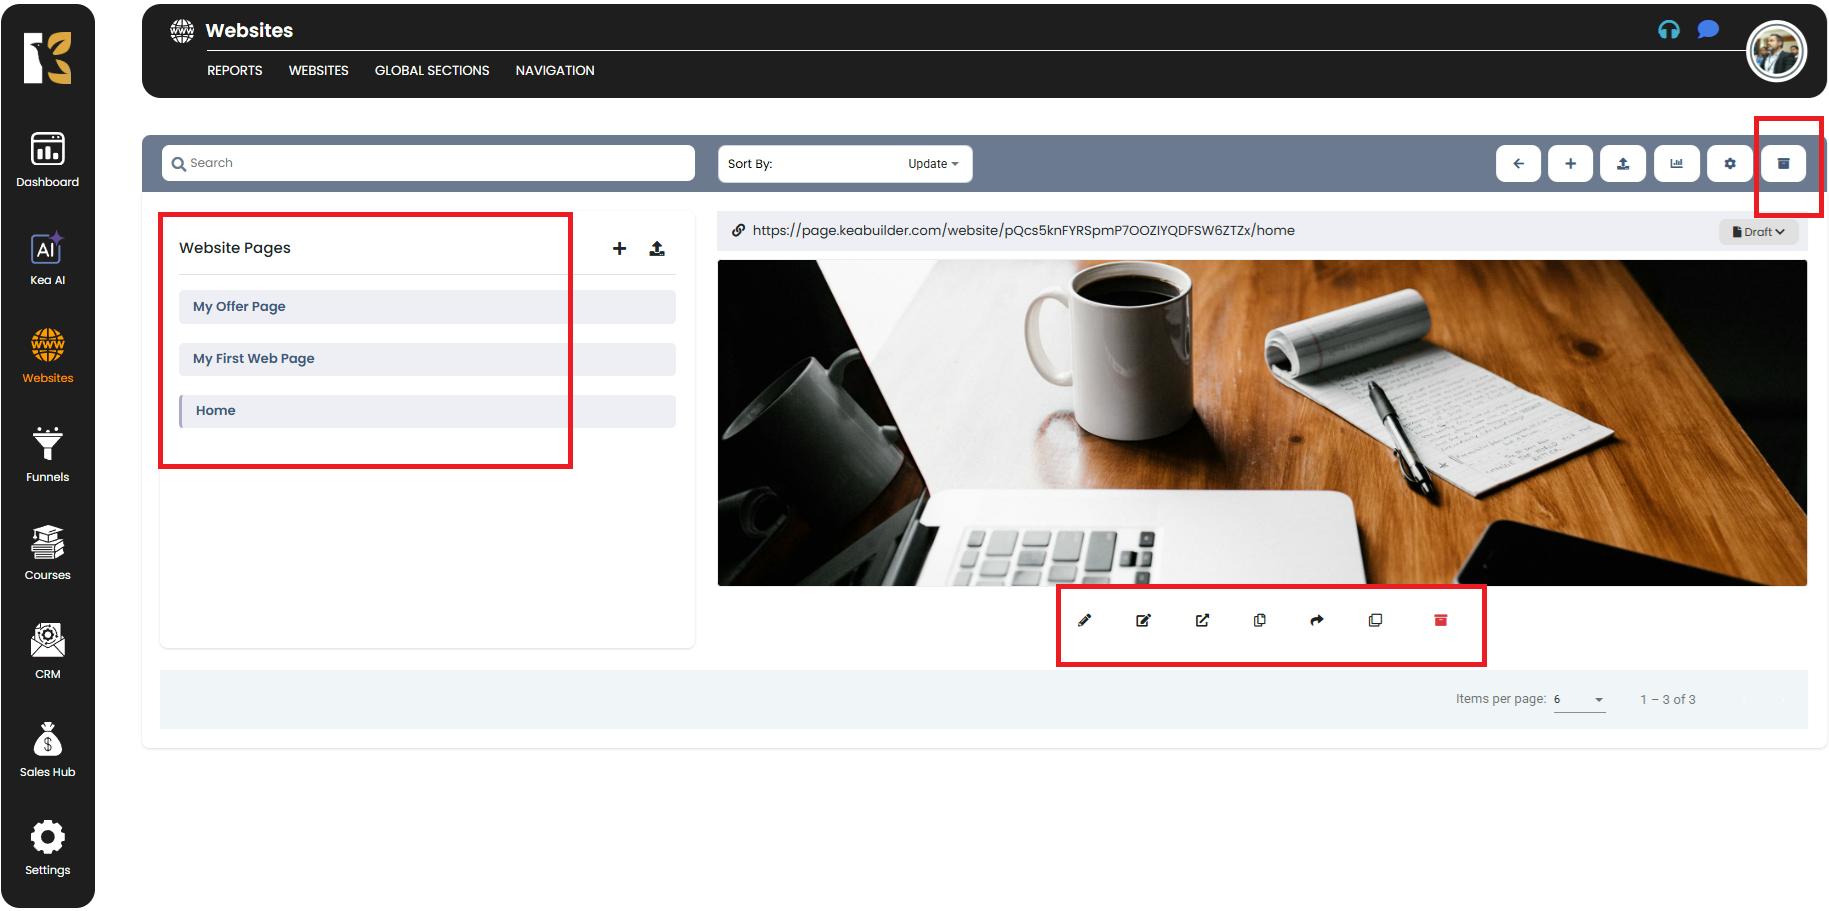
- After clicking edit, you’ll be taken to the Website Dashboard.
- This dashboard displays all the webpages you’ve designed under that particular website.
Step 5: Locate the Stats Option
- On the top horizontal menu bar of the website dashboard, you will find multiple management options.
- Look for the Bar Chart icon (Stats button) located towards the right side.
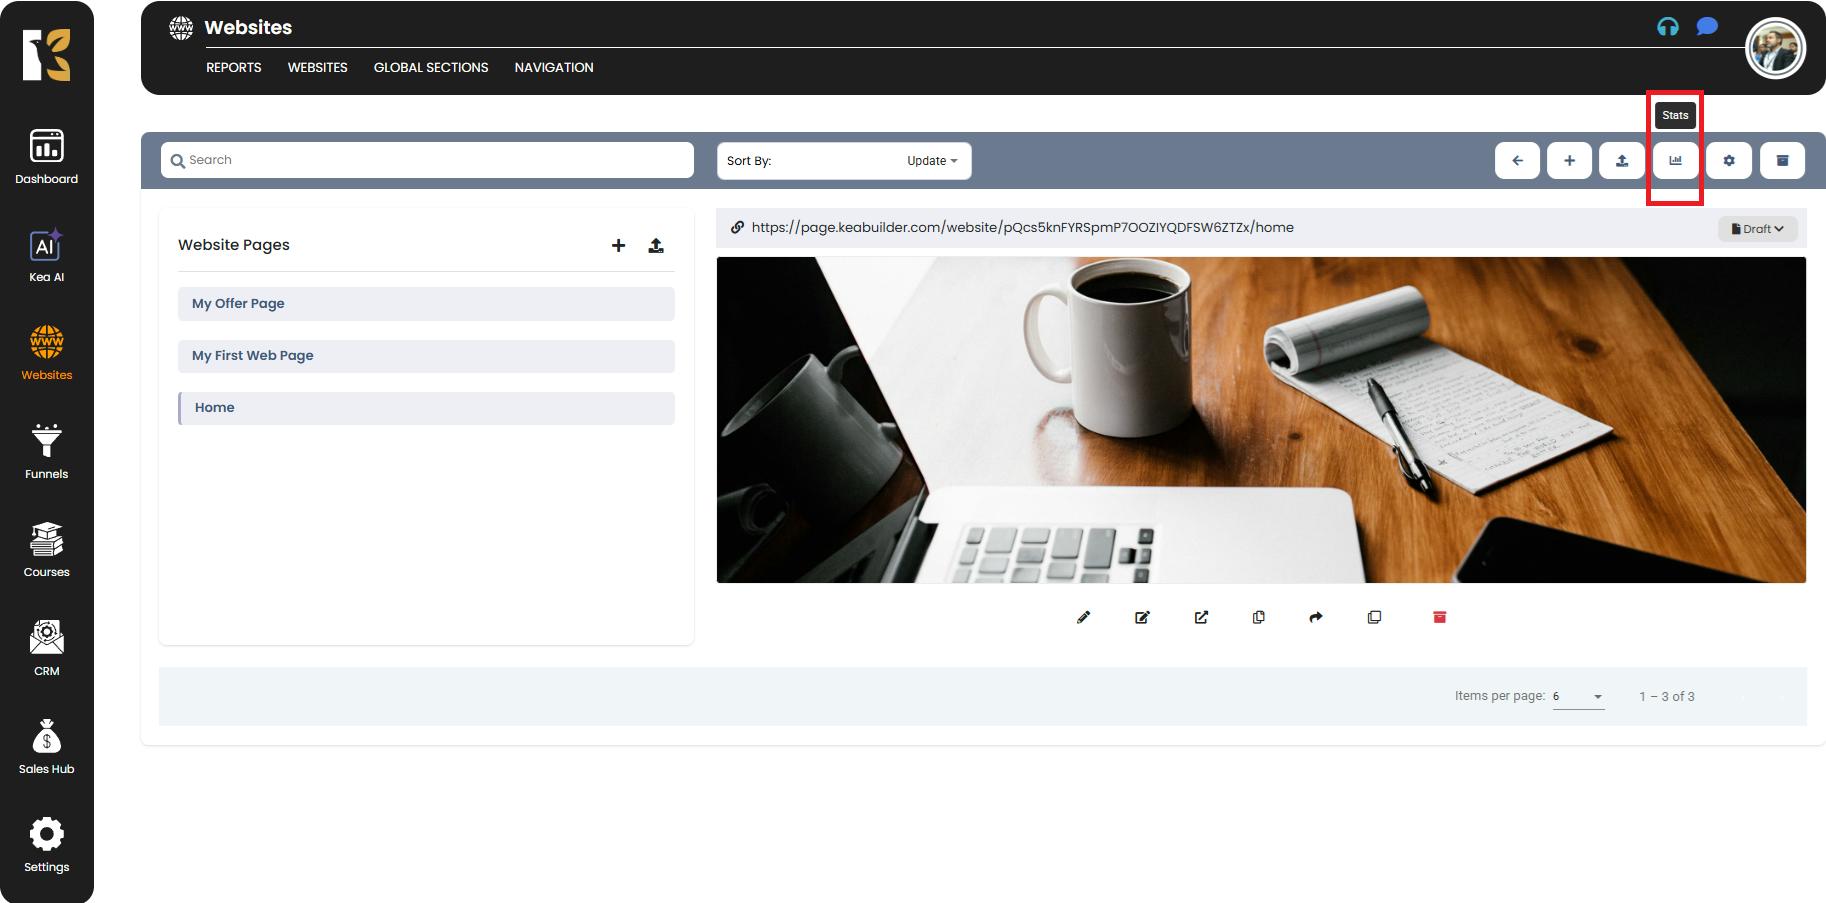
Step 6: Open Page Stats
- Click on the Bar Chart (Stats) button.
- You will be redirected to the Statistics Section, where detailed metrics for all pages will be displayed.
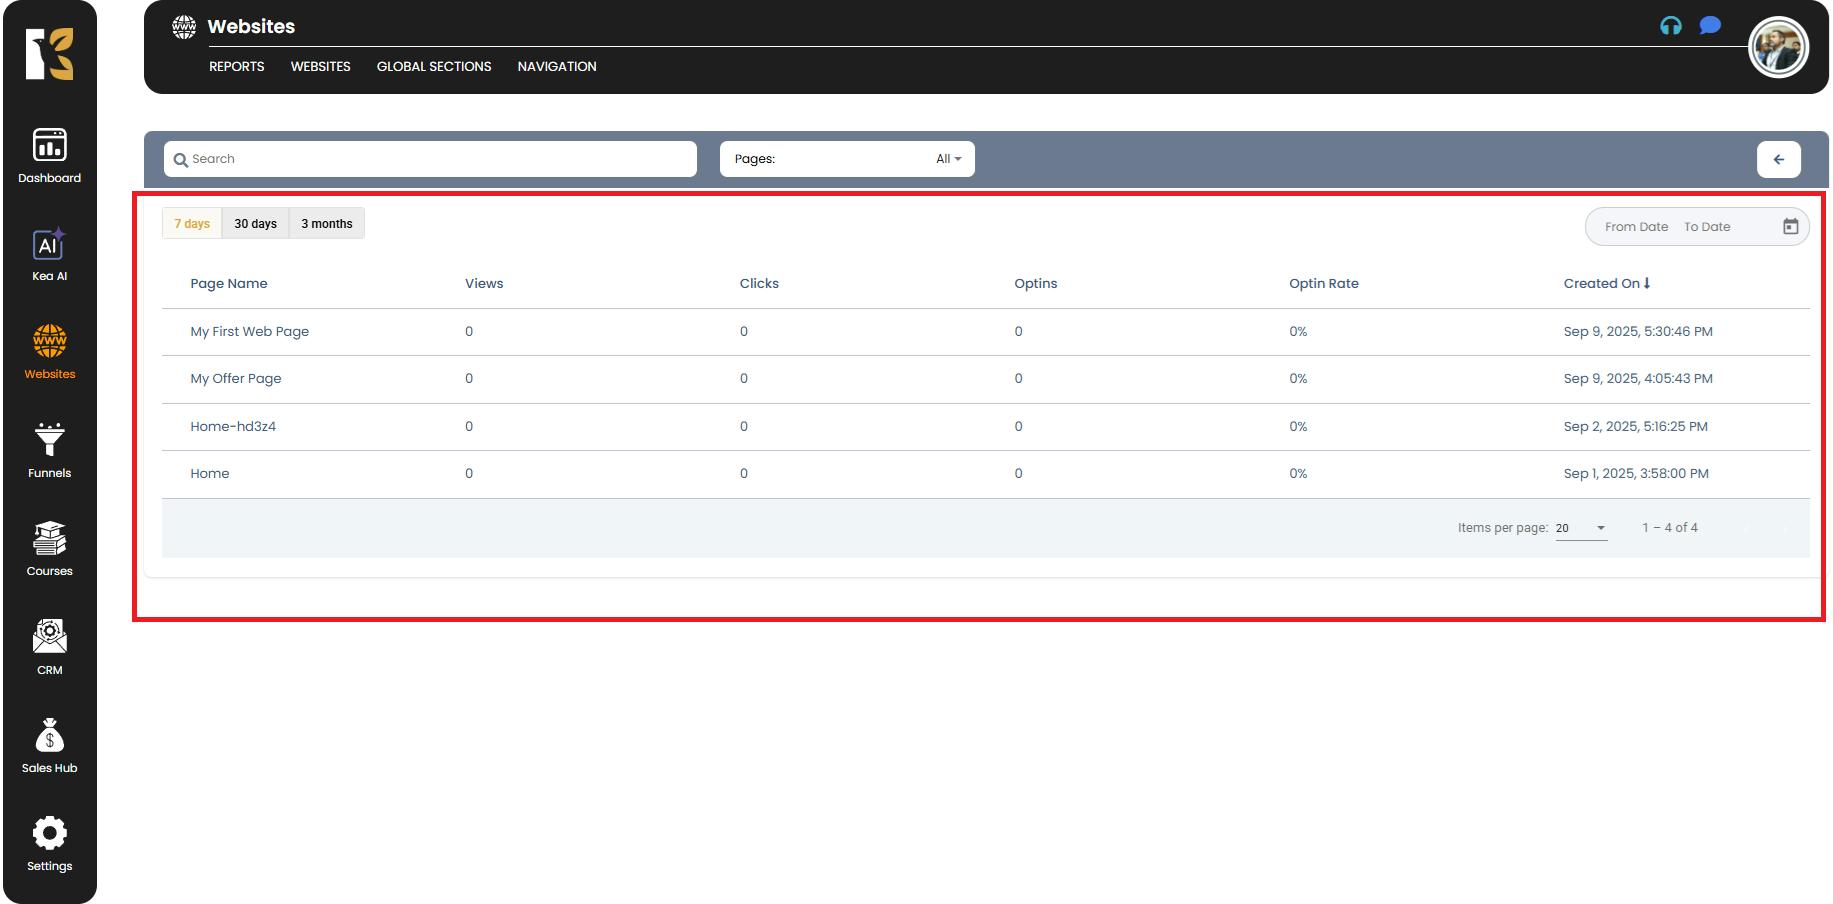
Step 7: Review Page Performance Metrics
In the Stats Section, you can view the following details for each webpage:
- Page Name – The title of the webpage.
- Views – Number of times the page has been visited.
- Clicks – Number of clicks recorded on that page.
- Opt-ins – Number of leads or sign-ups generated.
- Opt-in Rate – Conversion percentage based on visits and opt-ins.
- Created On – Date when the page was created.
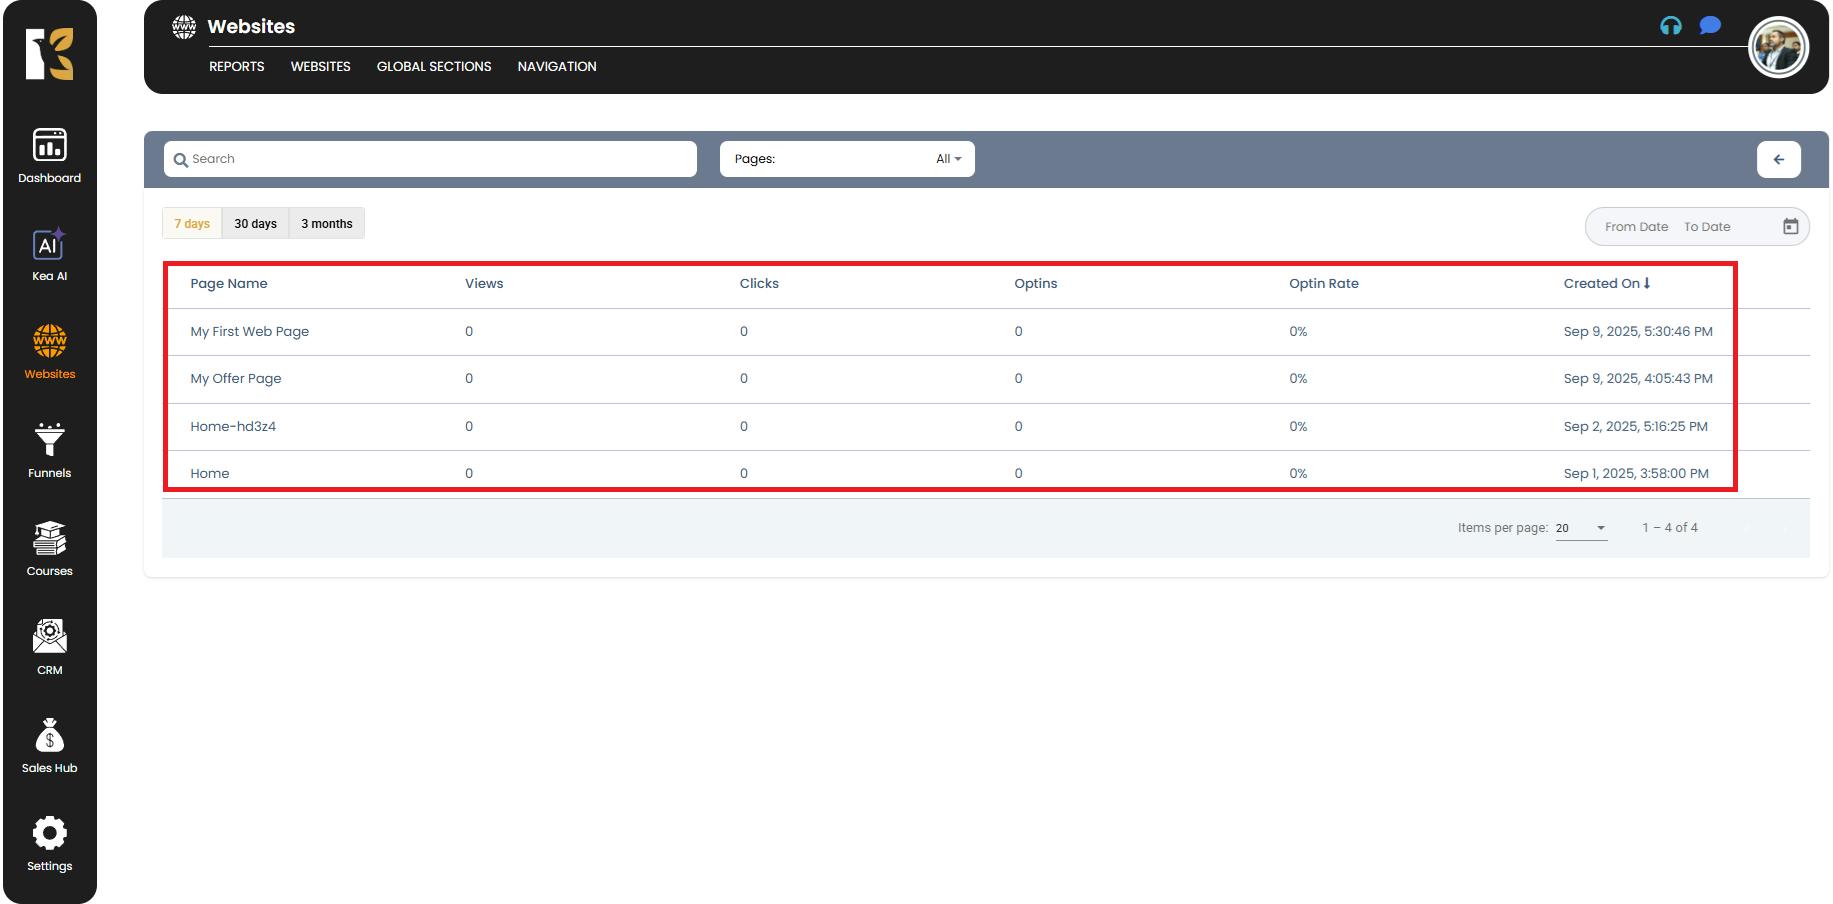
This gives you a comprehensive view of user interactions and performance.
Step 8: Filter by Date Range
- To refine your insights, you can select different date ranges for statistics.
- Pre-set options include:
- Last 7 Days
- Last 30 Days
- Last 3 Months
- You can also set a Custom Date Range by selecting specific “From” and “To” dates.
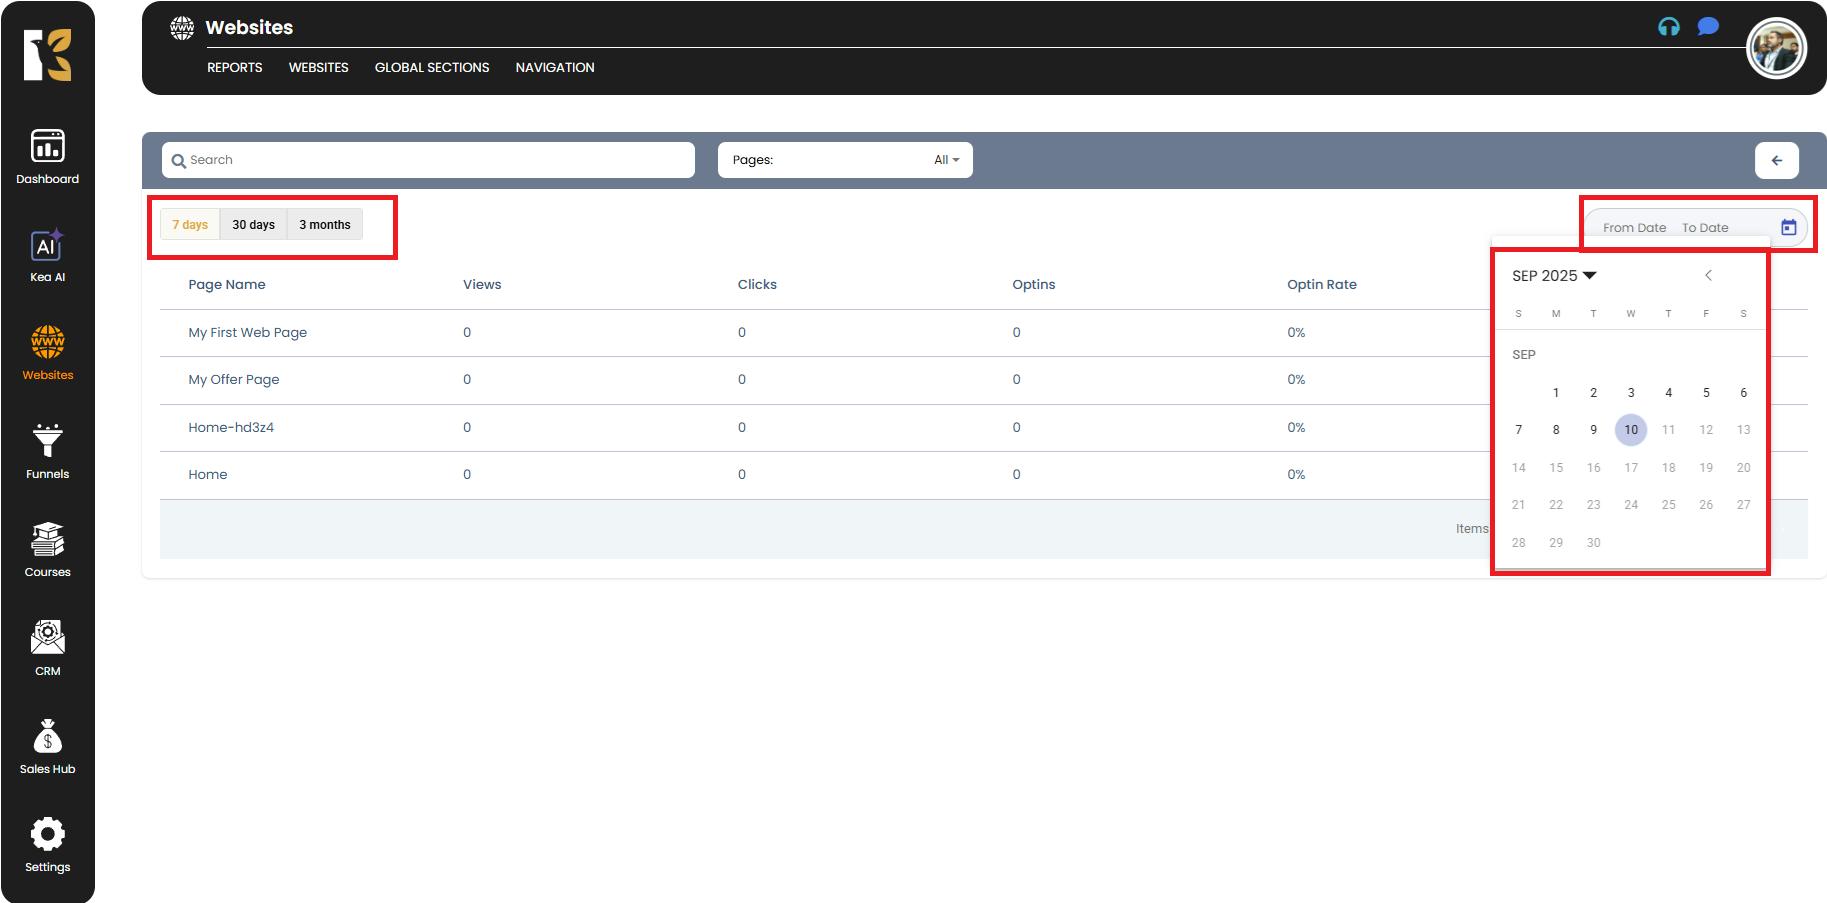
This flexibility allows you to analyze trends over short-term and long-term periods.
Why This Is Useful
- Identify high-performing pages.
- Discover pages with low conversions that need improvement.
- Track the impact of campaigns by comparing stats before and after launch.
- Optimize content, design, or call-to-actions based on real data.